Ramp Meters
Ramp meters are represented by the on the action panel. You can use the ATMS to:
- View the status and current metering mode of a ramp meter
- Override the metering mode of a meter
- View the ramp lane detectors
- View the mainline lane detectors
- Override the rate table of a meter
- Monitor current conditions at a ramp meter
Turn the Ramp Meter Layer On or Off
To turn the ramp meter layer on or off, click the on the action panel. When the ramp meter layer is displayed, the icon is highlighted.
Ramp Meter Icons
The ramp meter icons indicate the status of each meter, whether the meter is metering, and if an override is present. The meter icons you will see are as follows:
| ICON | DESCRIPTION |
|---|---|
| Blank: An all-black meter indicates that the meter is dark, or different lanes have different modes. | |
| Green: A meter with a grey top lamp and a green bottom lamp indicates the meter is in green rest. | |
| Metering: A meter with a red top lamp and green bottom lamp indicates the meter is metering. | |
| Override: A meter with a badge in the top right corner indicates the meter mode has been overridden by an ATMS user. | |
| Warn: A meter with a yellow border indicates the meter has non-fatal errors, such as errors on detection. ATMS is communication with the ramp meter. | |
| Error: A meter with a red border indicates the meter is not communicating or has an error preventing the ATMS from controlling it. | |
| Disabled: A grey face indicates that the ramp meter has been disabled by a user. The ATMS will not communicate with a meter while it is disabled, and will have no information about the current mode or status of the meter. |
View a Ramp Meter List
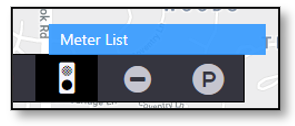
To open a list of all meters configured in the ATMS, right click on the Ramp Meter icon on the action panel and select the Meter List option.
The ramp meter list indicates:
- The status of each controller
- The current metering mode for each controller and
- The presence of a manual override on the meter
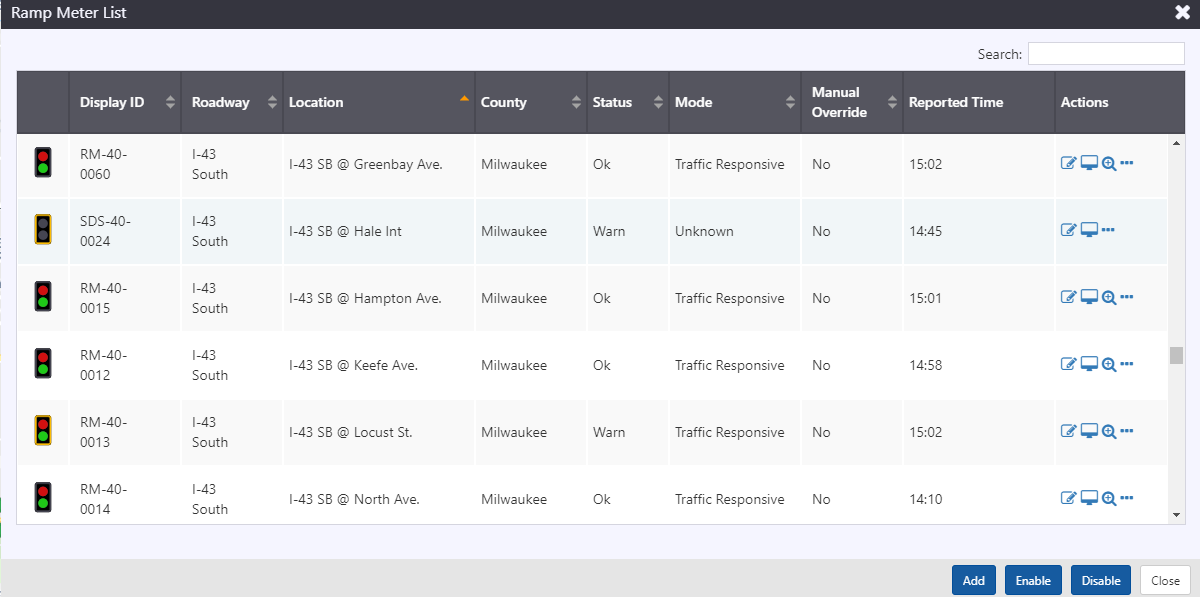
Each row contains a set of buttons that can be used to manage the controller.
| BUTTON | ACTION |
|---|---|
| Open ramp meter properties screen | |
| Open ramp meter monitoring screen | |
| Center the map on the ramp meter (not available for controllers with no metered lanes) | |
Open Menu with options to
|
Search for a Ramp Meter
You can search the ramp meter list using the Search box at the top right of the window. See section Search a List for more details.
Sort the Ramp Meter List
You can sort the list by the icons in its header. See section Sort a List for more details.
Manage a Ramp Meter
The Ramp Meter Properties view provides access to more detailed information about a ramp, and to ramp meter control features. To open the properties view for a ramp meter you can either:
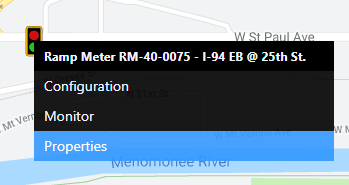
- Right click on the map icon of the desired ramp meter and select Properties
- Click on the
button for the desired meter in the Meter List
The properties view includes a fixed portion at the top that displays the meter's status and current message. It also provides options to:
- Enable or Disable communication with the meter
- Status Poll : retrieve a current update from the ramp meter
The rest of the properties view is divided into tabs:
- Mode : Control the metering mode of the ramp lanes
- Ramp : View live volume and occupancy for the ramp lanes, and detector status
- Mainline : View live speed, volume, occupancy and length for the mainline lanes, and lane status
- Rate Table : Control the rate table for ramp lanes
- Details : View some ramp meter configuration information and detailed error messages
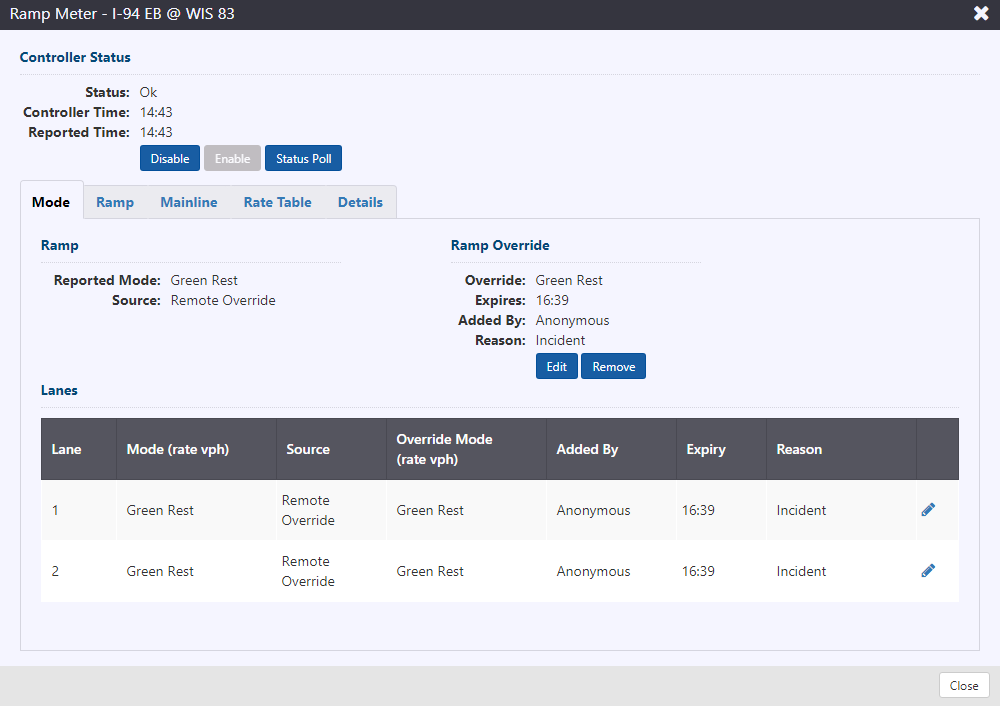
View Meter Status
The current mode of the ramp is indicated on the Mode tab. The mode and source are reported under Ramp.

Modes, their source, as well as the current target and effective rates (if applicable) are reported under Lanes.

Override Metering Mode
You can manually override a ramp meter mode by right-clicking its icon in the map and selecting the Properties option, or opening the properties window from the meter list. Overrides are possible for all ramp lanes or individual ramp lanes.
To override the metering mode for all lanes, go to the Mode tab of the ramp metering Properties view, and click on the Override button.
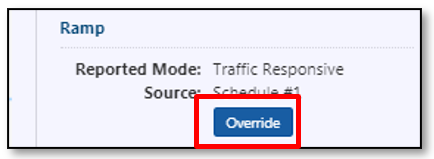
The Override All Lanes window is shown. The red outline of a field indicates that they are mandatory. Select the Type of mode override, and indicate expiry time in Expires and Reason for override.
The available ramp lane mode types for manual override include:
- Traffic Responsive : respond to traffic conditions on the mainline lanes
- Fixed Rate : meter at a fixed number of vehicles per hour
- Green Rest : maintain green signal
- Dark : turn off signal
- Emergency Green : proceed immediately to green signal
The Rate (VPH) field applies to the Fixed Rate Type only. It will become active if Fixed Rate is selected for Type.
Click Override to apply. The manual override is applied all lanes at the ramp. The Mode tab of the ramp meter Properties view will update to indicate the override:
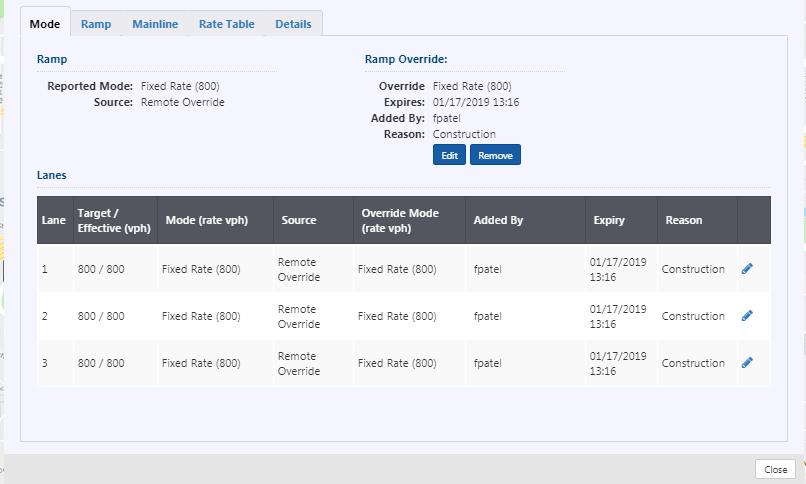
The ramp meter icon on the map will update to indicate that a mode override is active.
Overrides can also be applied on a lane-by-lane basis, by selecting the icon to the right of the lane

View Ramp Lanes and Detectors
You can view ramp detectors on the Ramp tab. Live volume and occupancy are available for ramp lanes.
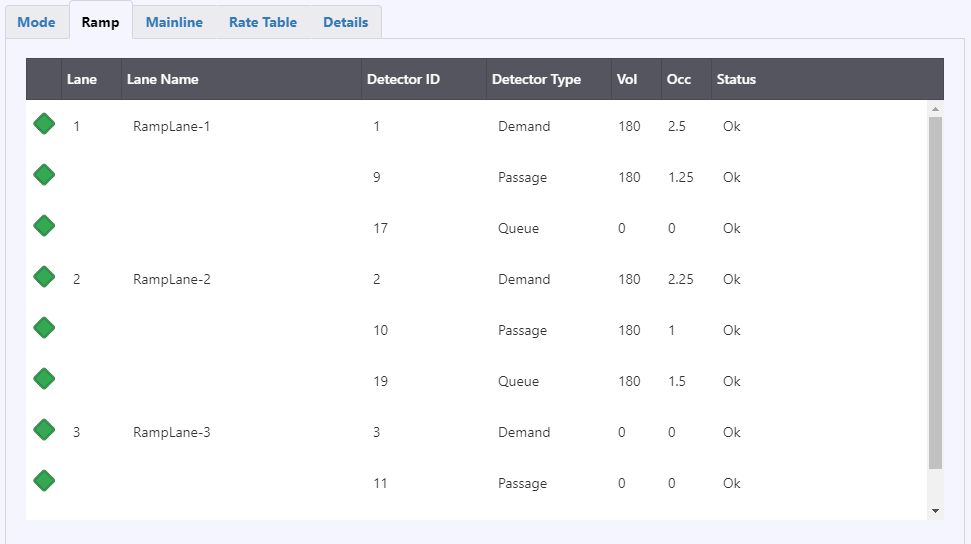
Diamonds to the left of individual detectors are colored based on their status: green/ok, yellow/detector error, grey/disabled. Status errors are provided from the controller, and include max presence, no activity, and erratic count.
View Mainline Lanes and Detectors
You can view mainline detectors on the Mainline tab. Live speed, volume, occupancy and length are available for mainline lanes
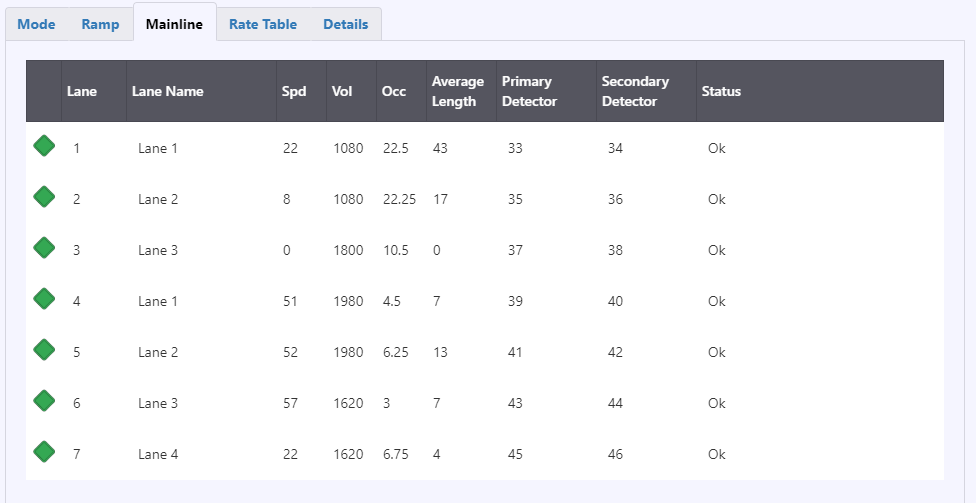
Diamonds to the left of lanes are colored based on the status of their detectors: green/ok, yellow/detector error, grey/disabled. Status errors are provided from the controller, and include max presence, no activity, and erratic count.
Override Rate Table
You can manually override a ramp meter rate table by right-clicking its icon in the map and selecting the Properties option, or opening the properties window from the meter list. Overrides are possible for all ramp lanes or individual ramp lanes.
To override the metering rate table for all lanes, go to the Rate Table tab of the ramp metering Properties view, and click on the Override button. If an override is already present this button will not appear; instead the override rate table can be modified.
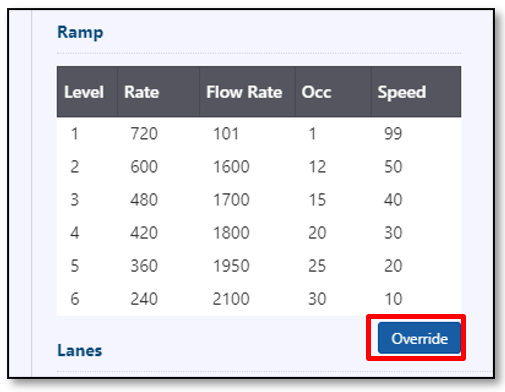
The Override All Lanes window is shown. Select to edit a level in the rate table, which will make the rate level values editable. Type a new value or use the incrementers to change the value. Edited values can be accepted by selecting
to accept or
to cancel. Indicate the expiry time in Expires and Reason for override. Expiry and Reason are required fields to save the override. Click Save to apply.
The Rate table tab of the ramp meter Properties view will update to indicate the override: Any temporary override to the Rate Table is noted to the right of the rate table.

Additionally, rate table overrides are listed by lane under the Lane heading. You can override the rate table for a meter by selecting the icon to the right of the lane

Monitor a Ramp Meter
The Ramp Meter Monitor view provides access to current status information about a ramp meter,. To open the properties view for a ramp meter you can either:
- Right click on the map icon of the desired ramp meter and select Monitor
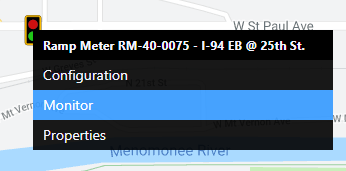
- Click on the
button for the desired meter in the Meter List
The monitor view includes a fixed portion at the top that displays the meter's status and current message. It also provides information regarding:
- Controller Status
- Controller Time : Time on the controller
- Controller Last Updated : Last update time of the controller configuration
- Reported Time : Timestamp for the data shown
- IP:Port
The monitor view updates with each status poll. The rest of the monitor view is divided into sections:
- Ramp : Information about the dependency group, metered lane status, and ramp detection
- Mainline : Mainline traffic conditions

You can select which dependency group data to monitor using the Dependency Group drop down. The service mode for the dependency group and any active overrides are reported to the right of the dependency group.
View Schedule
You can view the current schedule of the ramp meter by clicking View Schedule. A schedule popup appears below the button.
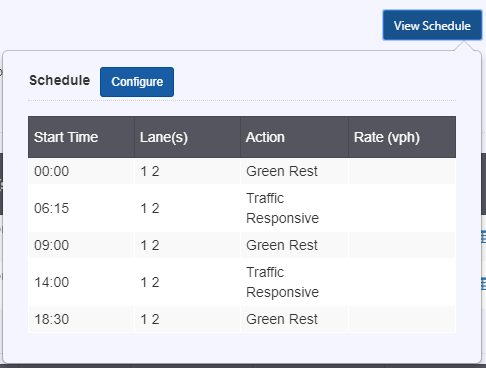
Each row in the schedule denotes an entry in the schedule, including the start time when it occurs, the lanes impacted by the action, the action to take at that point in time, and the rate in vph if the action is fixed rate. You can navigate to the schedule tab of ramp meter configuration by clicking Configure.
View Meter Status
You can view current status of ramp meter lanes in the meters section under Ramp.
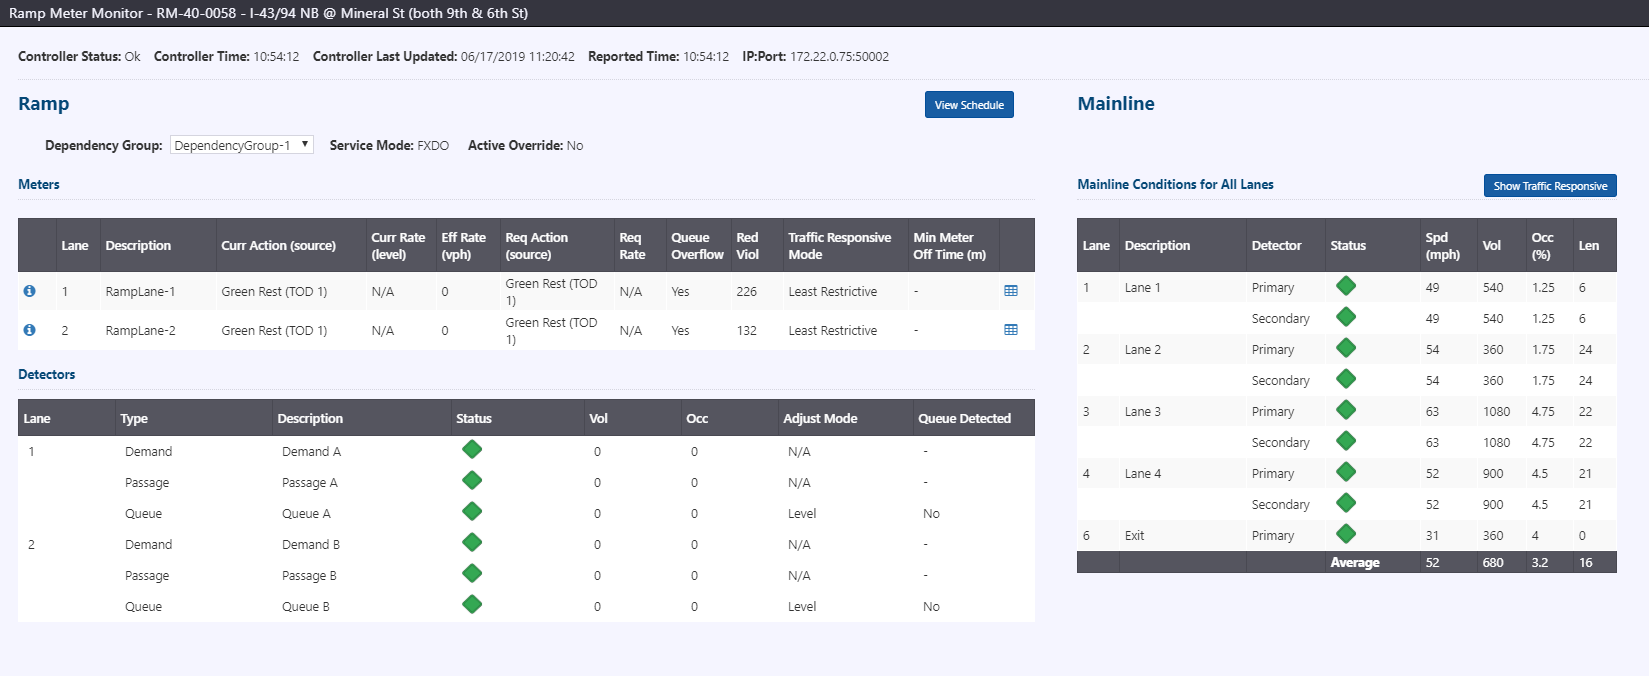
Each metered lane is listed, including:
- Current action (and source of the action)
- Current rate (and level, if based on the rate table)
- Effective rate, based on the duration between red to green signal transitions
- Requested action (and source of the requested action) as commanded
- Requested rate as commanded
- Queue overflow, based on the queue alert value configured in the controller
- Red violations detected since metering last began
- Traffic responsive mode configured for the ramp lane
- Minimum meter off time configured before metering can begin after turning off
Abnormal conditions on a ramp lane are will trigger an info icon at the left of the lane entry. Hovering over  will provide information as to the abnormal condition, such as the queue overflow alarm being triggered or the reported current mode differs from expected.
View Rate Table
You can view the current rate table of a metered lane by clicking  to the right of the metered lane. A rate table popup appears below the button.
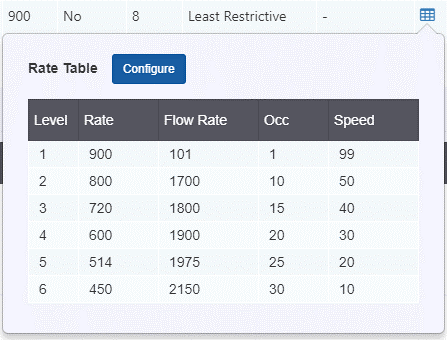
Each row in the rate table denotes a level, including the rate, flow rate, occupancy and speed thresholds.
You can navigate to the rate table tab of ramp meter configuration by clicking Configure
View Ramp Conditions
You can view ramp detectors under the detectors section. Live volume and occupancy are available for ramp detectors, as well as the queue adjust mode and detector presence (as reported by the controller) for queue detectors.

Status diamonds are colored based on their status: green/ok, yellow/detector error, grey/disabled. Status errors are provided from the controller, and include max presence, no activity, and erratic count. Hovering over the diamond indicates the type of error.
View Mainline Conditions
You can view mainline detectors under the mainline section. Live speed, volume, occupancy and length are available for mainline lanes. Length and speed will be identical for primary and secondary detectors in a lane.

Status diamonds are colored based on their status: green/ok, yellow/detector error, grey/disabled. Status errors are provided from the controller, and include max presence, no activity, and erratic count. Hovering over the diamond indicates the type of error.
The monitor screen defaults to showing all mainline lanes. You can view the conditions on only the mainline lanes associated with traffic responsive metering by clicking Show Traffic Responsive. When only traffic responsive lanes are shown, the average row at the bottom provides averages only for displayed lanes. You can click Show All Lanes to return to displaying all mainline lanes.
Enable or Disable a Ramp Meter
When a ramp meter is Disabled, the ATMS stops communicating with it, overrides can be added, and the ATMS will not check the status of the meter. The meter icon updates to indicate the meter is disabled.
You can Enable or Disable a meter from either its Ramp Meter Properties view or from its entry in the Meter List.
To Enable or Disable a meter from its Ramp Meter Properties view, open the view for the desired meter either from the map icon, or the Ramp Meter List. Only one of the Enable or Disable buttons will be active, and the other will be grey/inactive, based on the current state of the meter. Click on the Enable or Disable button to turn the meter on or off in ATMS.

To Enable or Disable a meter from the Ramp Meter List, open the Ramp Meter List and find the desired meter. Click on the button to open the menu for that meter. Only one of the Enable or Disable menu options will be active and the other will be grey/inactive, based on the current state of the meter. Click on the Enable or Disable menu option to turn the meter on or off in ATMS.
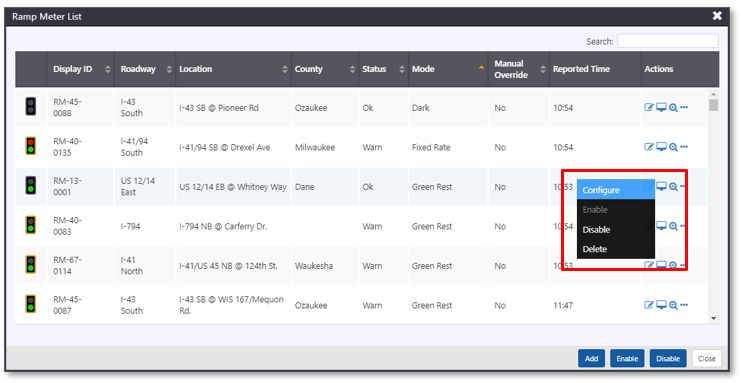
Enable or Disable Multiple Ramp Meters
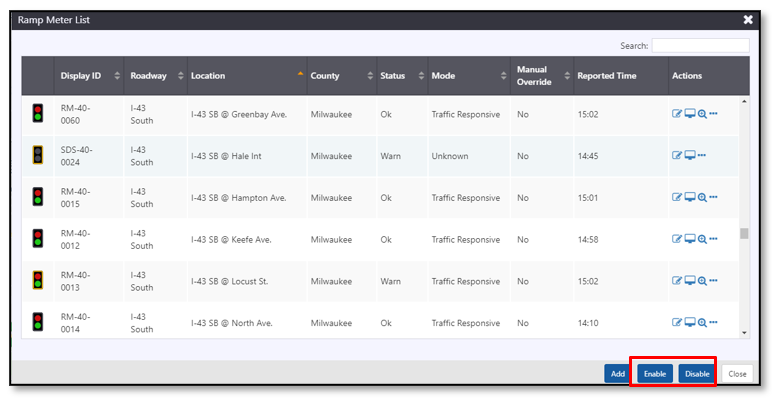
You can Enable or Disable multiple meters using the buttons at the bottom of the Ramp Meter List. Use the Search box to (optionally) filter the list to the set of meters to be enabled or disabled. The Enable button at the bottom of the list view will be active if any of the meters displayed in the list (based on your search) are disabled. The Disable button at the bottom of the list view will be active if any of the meters displayed in the list are enabled. Click Enable or Disable to turn all of the meters displayed in the list on or off in ATMS.
